
Noise Frequencies Let a Pixel-Space Diffusion Prior
Detect Native-Resolution Image

Bumsoo Kim1,*, Hyun-Jun Jin2,*, Mi Young Lee1, Seungmin Rho1, Sanghyun Seo1,†
1Chung-Ang University  ·  2Korea University
*Now with Smilegate AI  ·  Corresponding author
ECCV 2026 Workshop  ·  Low-Level Vision Frontier (LoViF)

Teaser


PixRes teaser

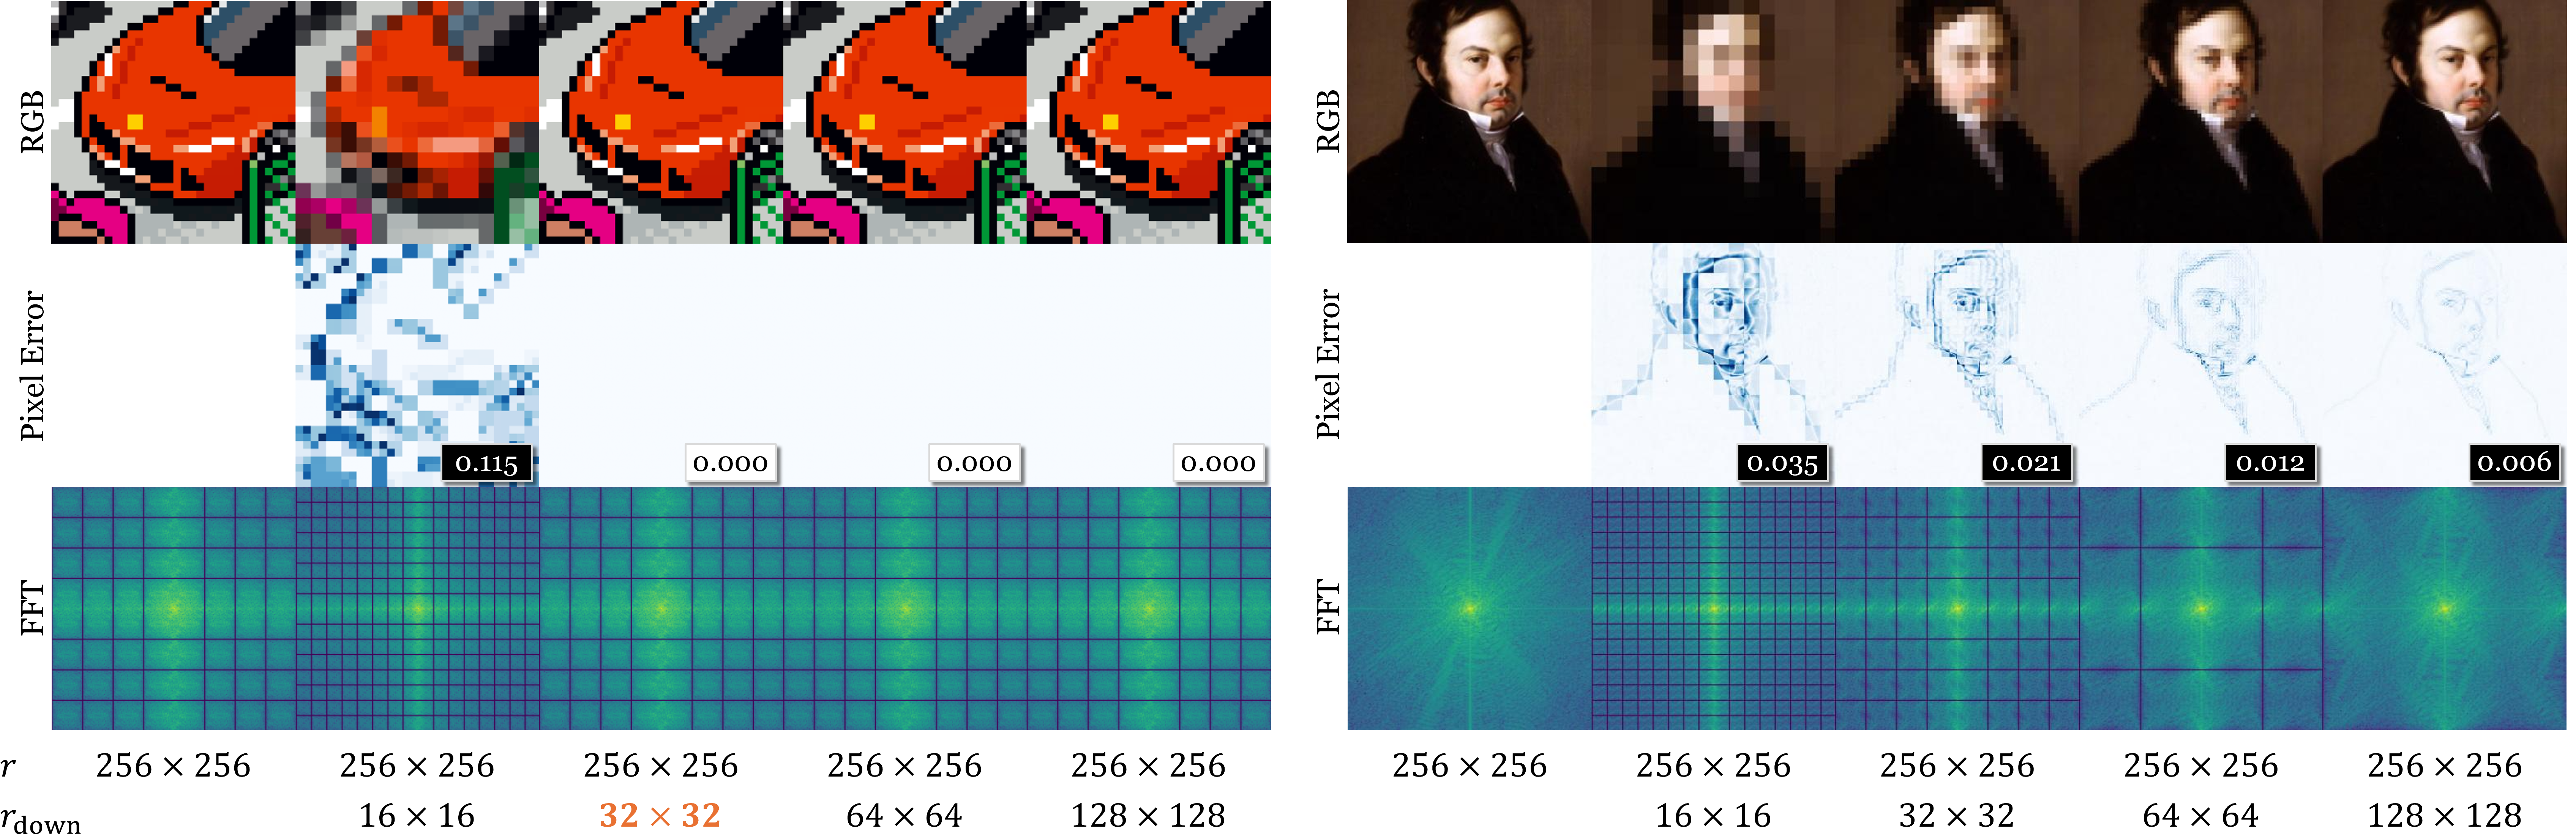
An image at a given resolution does not always carry the quality that resolution implies. Left: a 32×32 pixel-art can be losslessly recovered from its downscaled version — its true (effective) resolution is 32, well below the stored 256. Right: an artistic portrait shows visible reconstruction error at every downscale level, indicating a native effective resolution near 256. PixRes makes this distinction operational as a training-free native-image detector using a pretrained pixel-space diffusion prior.
TL;DR

PixRes asks whether an image sits at its native resolution or has been resampled from a lower one — a training-free binary check built on a pretrained pixel-space diffusion prior. A single PF-ODE (DDIM) inversion up to T/4 extracts a variance signal svar over the noise's high-frequency spectrum, giving a pooled detection AUC of 0.953 across 8 diverse domains — no supervision, no fine-tuning.

Input
x0  256×256
PF-ODE inversion
DDIM, T/4
Radial spectrum
R(x0; t, k)
Score svar
std over Tp×KHF
Detection
native? / reff

Headline Results


Pooled AUC
0.953
+0.035 vs SS-ERE
Subtle regime
0.807
+0.079 vs SS-ERE
Acc@10%
65.9%
+8.8 pp vs SS-ERE
Spearman ρ
0.709
+0.194 vs SS-ERE

Cross-domain means over 8 benchmarks — FFHQ, Set5, Set14, BSD100, Urban100, DIV2K, COCO, WikiArt. No labelled resolution data used at any point.


Native vs. Resampled — a Clean Split


s_var histogram

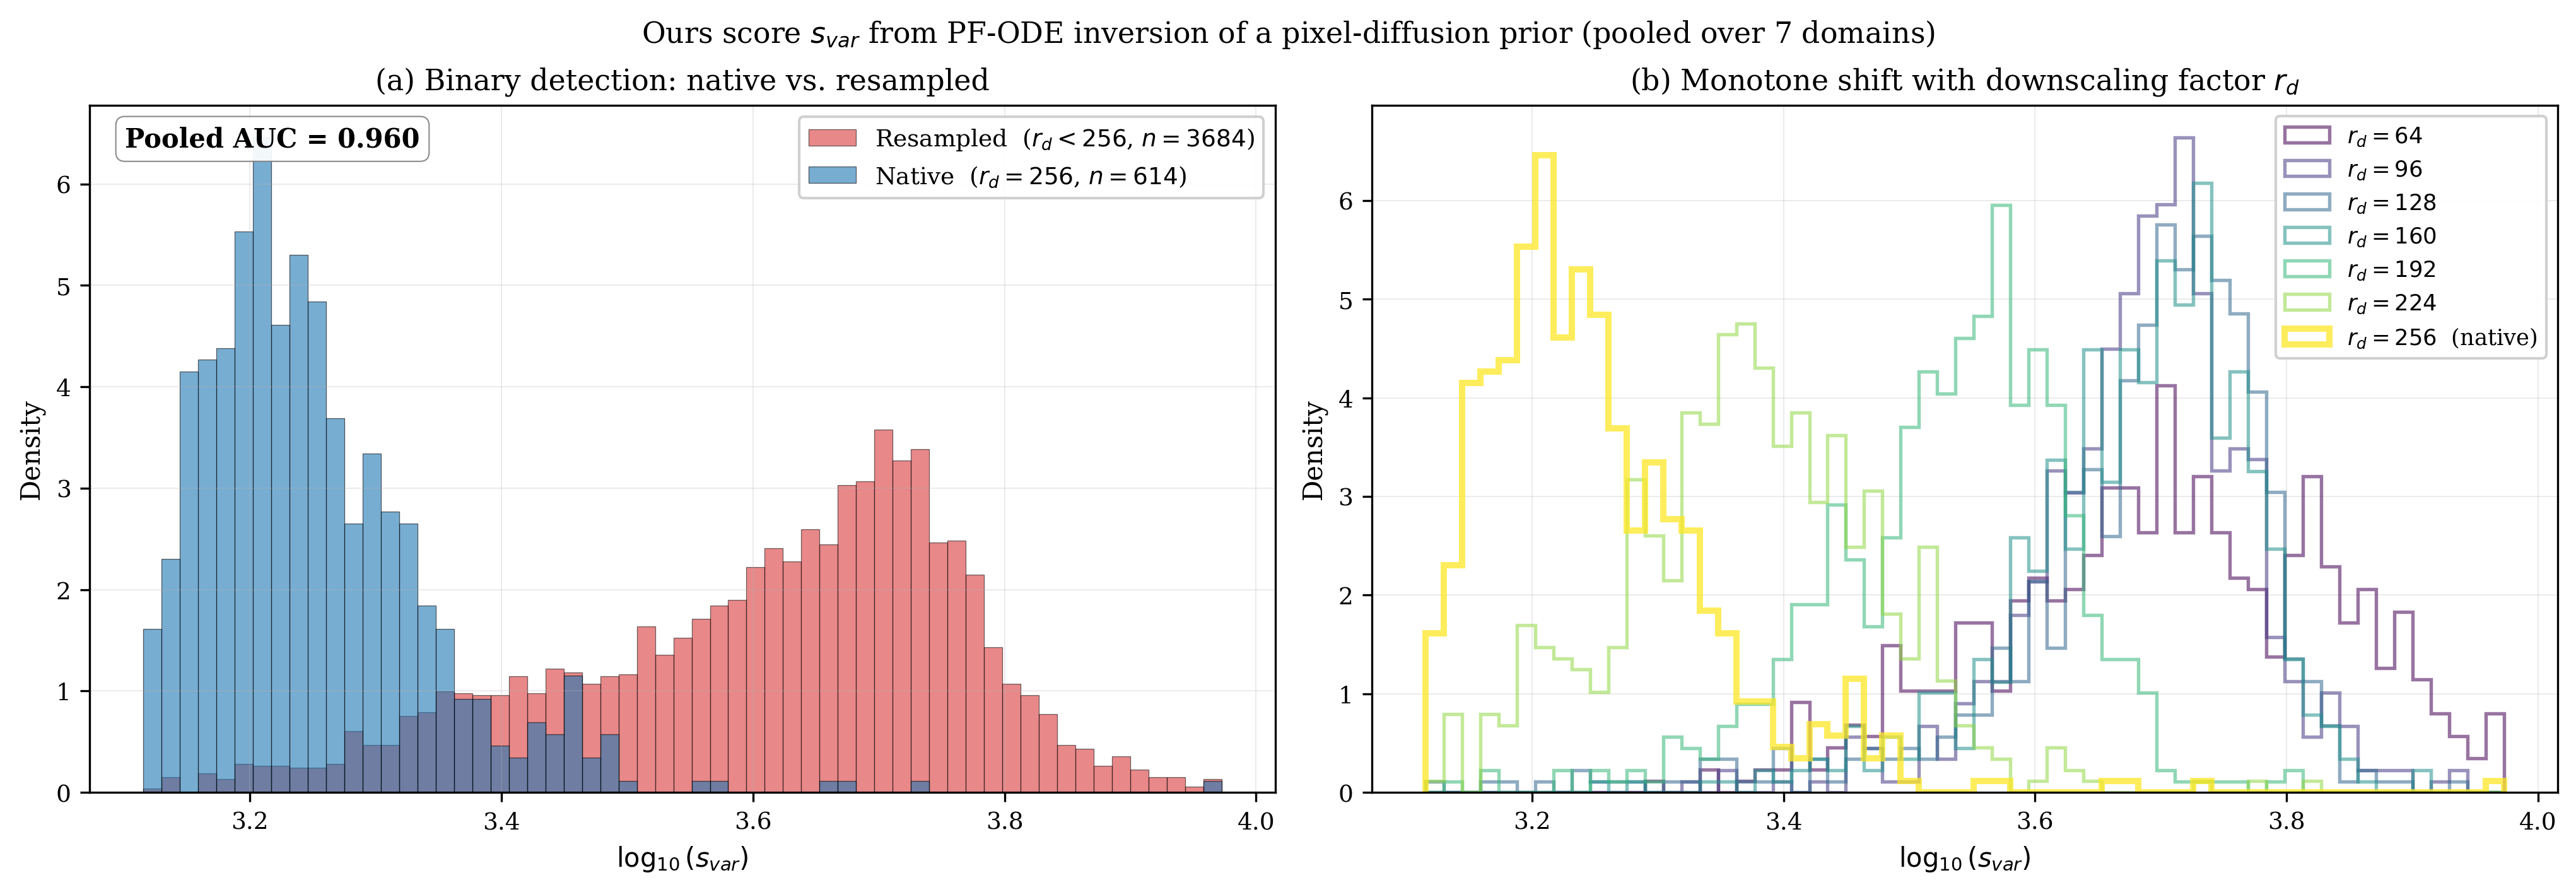
(a) Pooled over 7 diverse domains, native images (blue) sit near log10 svar ≈ 3.2, while resampled ones (red) sit near 3.7 — pooled AUC = 0.960. (b) As the downscaling anchor rd shrinks from 256 (native) to 64 (heavy downscaling), the distribution shifts monotonically — svar is a true continuous signal of effective resolution.


Explore the Signal Interactively


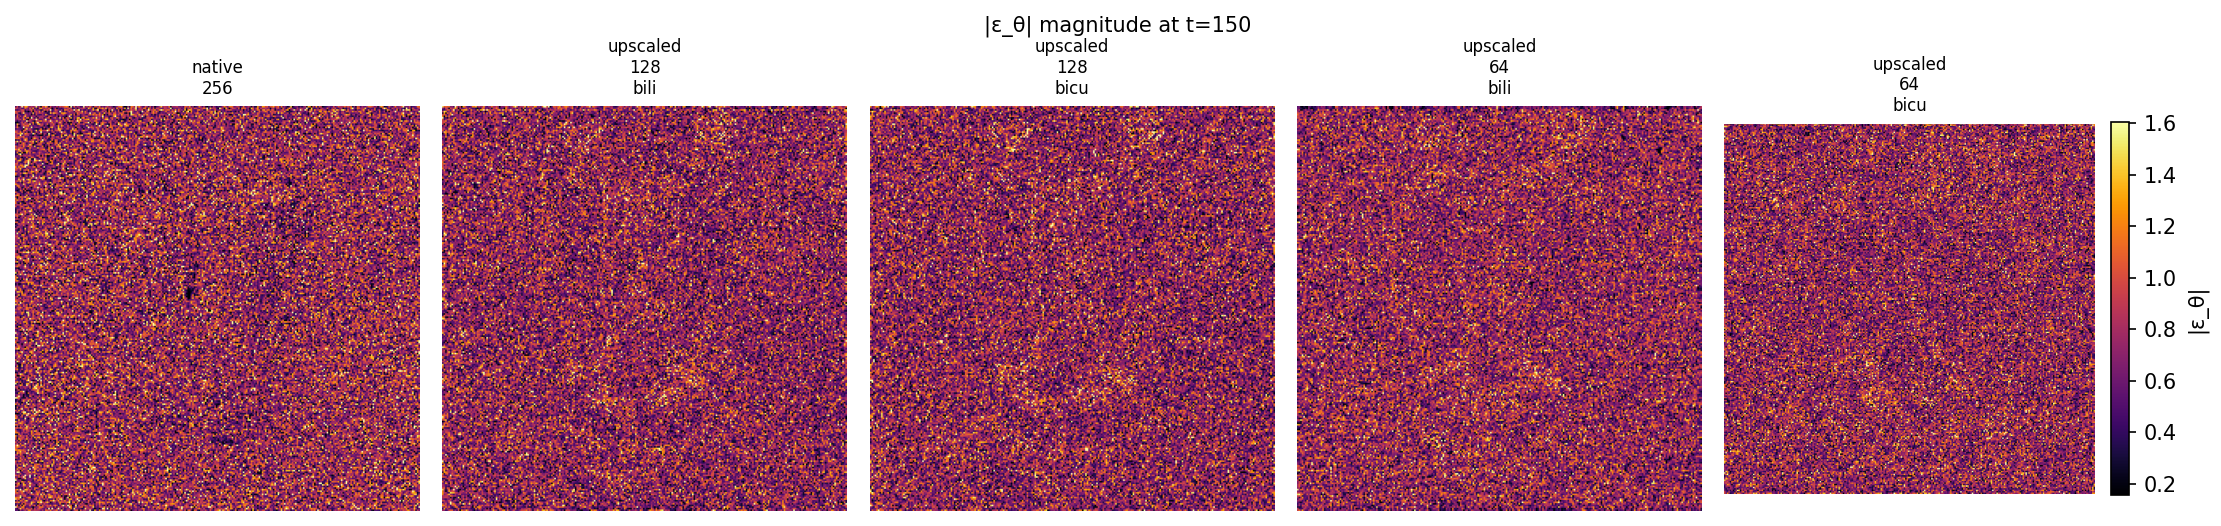
Predicted diffusion noise εθ(xt) at timestep t = 150 for each sample. Compare native vs. bicubically resampled inputs. (Timestep slider temporarily locked at t = 150 while we finish the multi-timestep results.)

Sample
Baboon Monarch Lenna Zebra Pepper
Timestep t
t=25t=150t=250
t=150  
Predicted noise magnitude  |  native vs upscaled 128 (bili / bicu) vs upscaled 64 (bili / bicu)
eps_theta magnitude grid
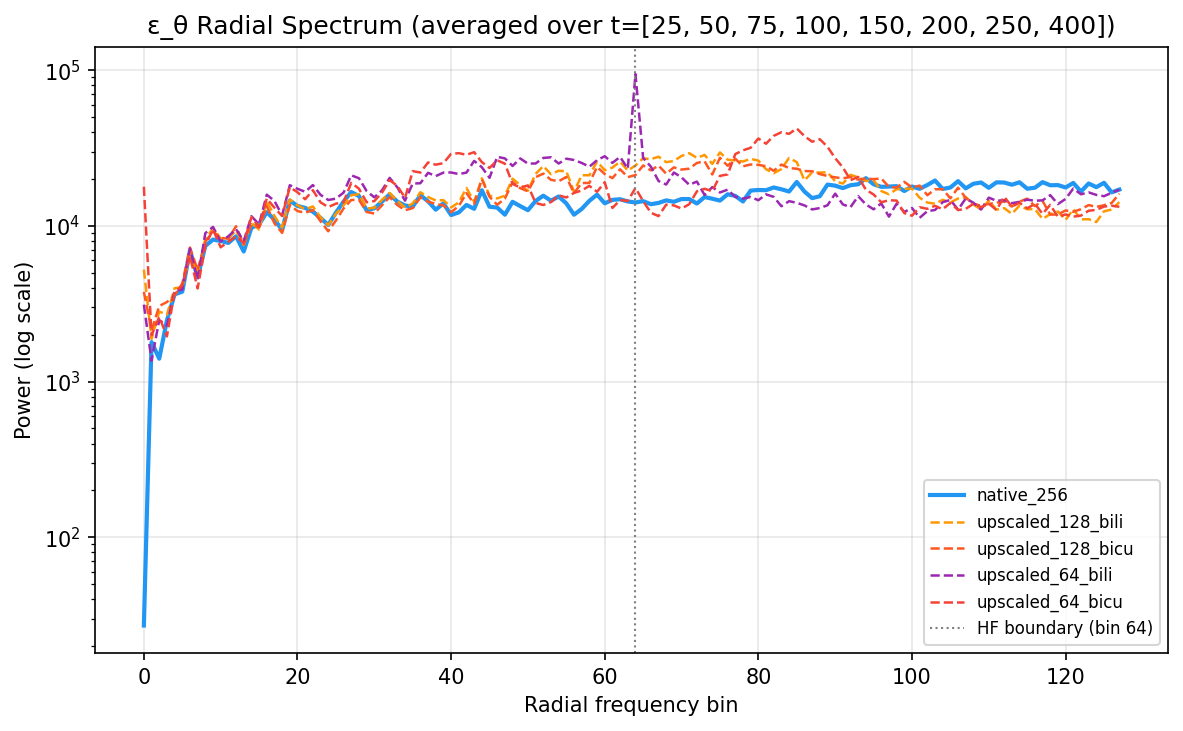
Radial power spectrum  R(x0; t, k)  (all t averaged)
radial spectrum

Watch the high-frequency region (k ≥ 64) in the spectrum panel: the native curve stays flat, while the resampled curves lift and bulge — exactly the mismatch svar quantifies.


Method Overview


PixRes method flow

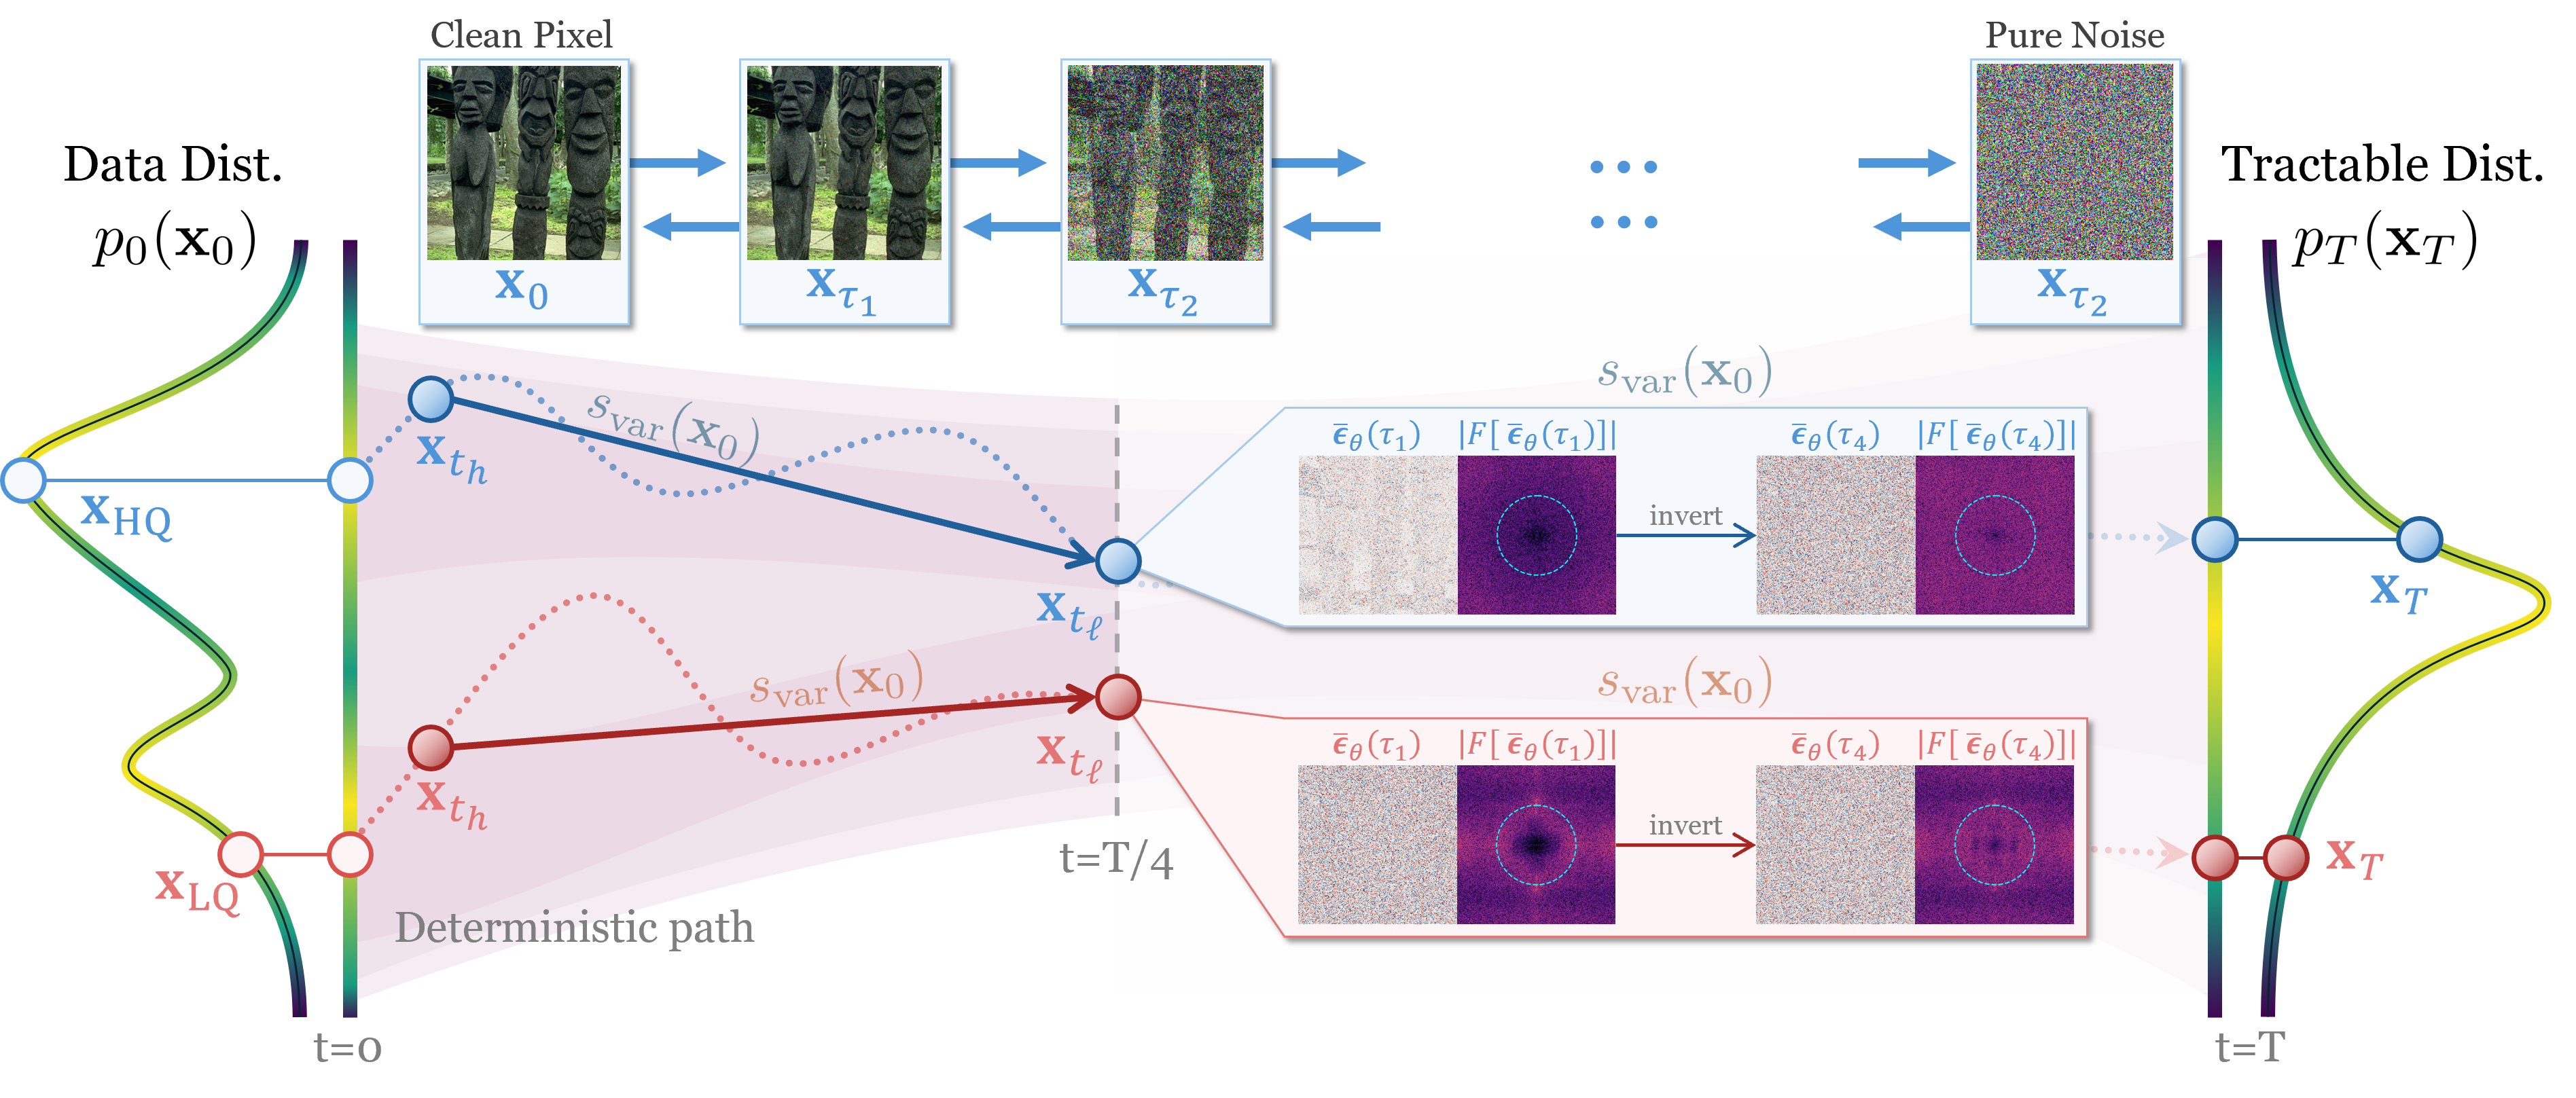
Deterministic PF-ODE inversion in pixel space. A clean input x0 is inverted along a deterministic trajectory up to t = T/4. At probe timesteps Tp = {τ1, …, τ4} we collect the predicted noise 𝜀̄θ(τ), take its 2-D FFT, and radially bin to obtain R(x0; t, k). For a native input (blue path, xHQ) the high-frequency shell (cyan circle) stays uniformly dim — the prior's expected noise complexity matches the input. For a resampled input (red path, xLQ) the same shell brightens as the prior tries to compensate for missing HF content. The joint std of R over the plateau and HF band is our scalar score svar.


The intuition is clean: at native resolution, the diffusion prior's expected noise complexity matches the input's true high-frequency content, so the radial spectrum stays flat across the plateau. When the input has been resampled, the prior still expects rich high-frequency noise, creating a variance mismatch that svar captures directly.


Test Datasets


Sample images from the eight test datasets

Random samples from the eight test benchmarks used throughout our experiments — a deliberate mix of natural, structured, face, and stylised domains. All images are prepared identically (center-crop + Lanczos to 256×256).

Dataset n Domain Role
DIV2K val100Natural, HRcalibration anchor source
DIV2K train100Natural, HRheld-out evaluation
COCO100Natural, in-the-wildevaluation
BSD100100Naturalevaluation
Urban100100Structured (buildings)evaluation
FFHQ100FaceSS-ERE’s training domain
WikiArt100Stylised (painting)domain-gap stress test
Set5 / Set145 / 14Classical SRcompleteness


Cross-Domain Robustness


cross-domain radar

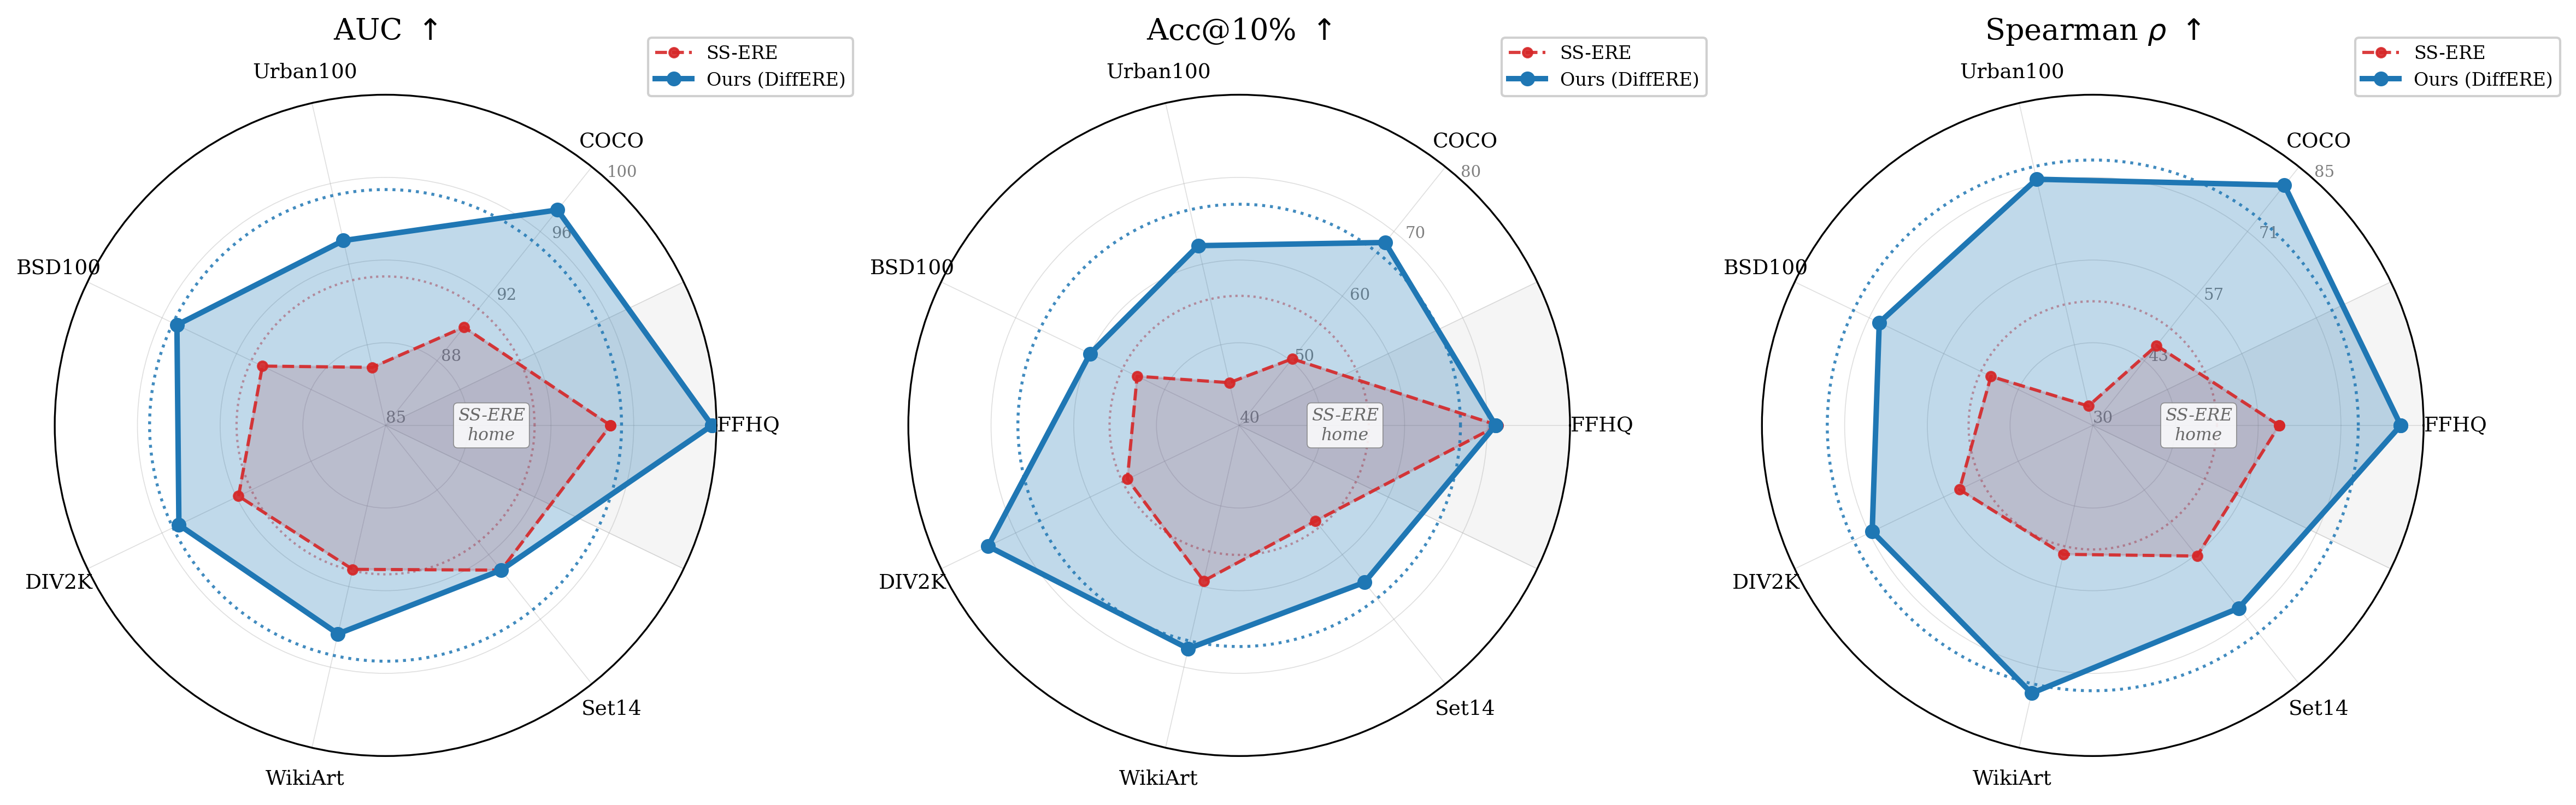
Three orthogonal aspects of score quality on seven benchmarks: (a) pooled detection AUC, (b) tight-tolerance reff regression accuracy (Acc@10%), (c) Spearman rank correlation. Ours (blue) dominates all three — +0.039 AUC, +11.1 pp Acc@10%, and +0.235 ρ on average — including on FFHQ, the domain on which SS-ERE was trained.


Per-Domain ROC Curves


per-domain ROC

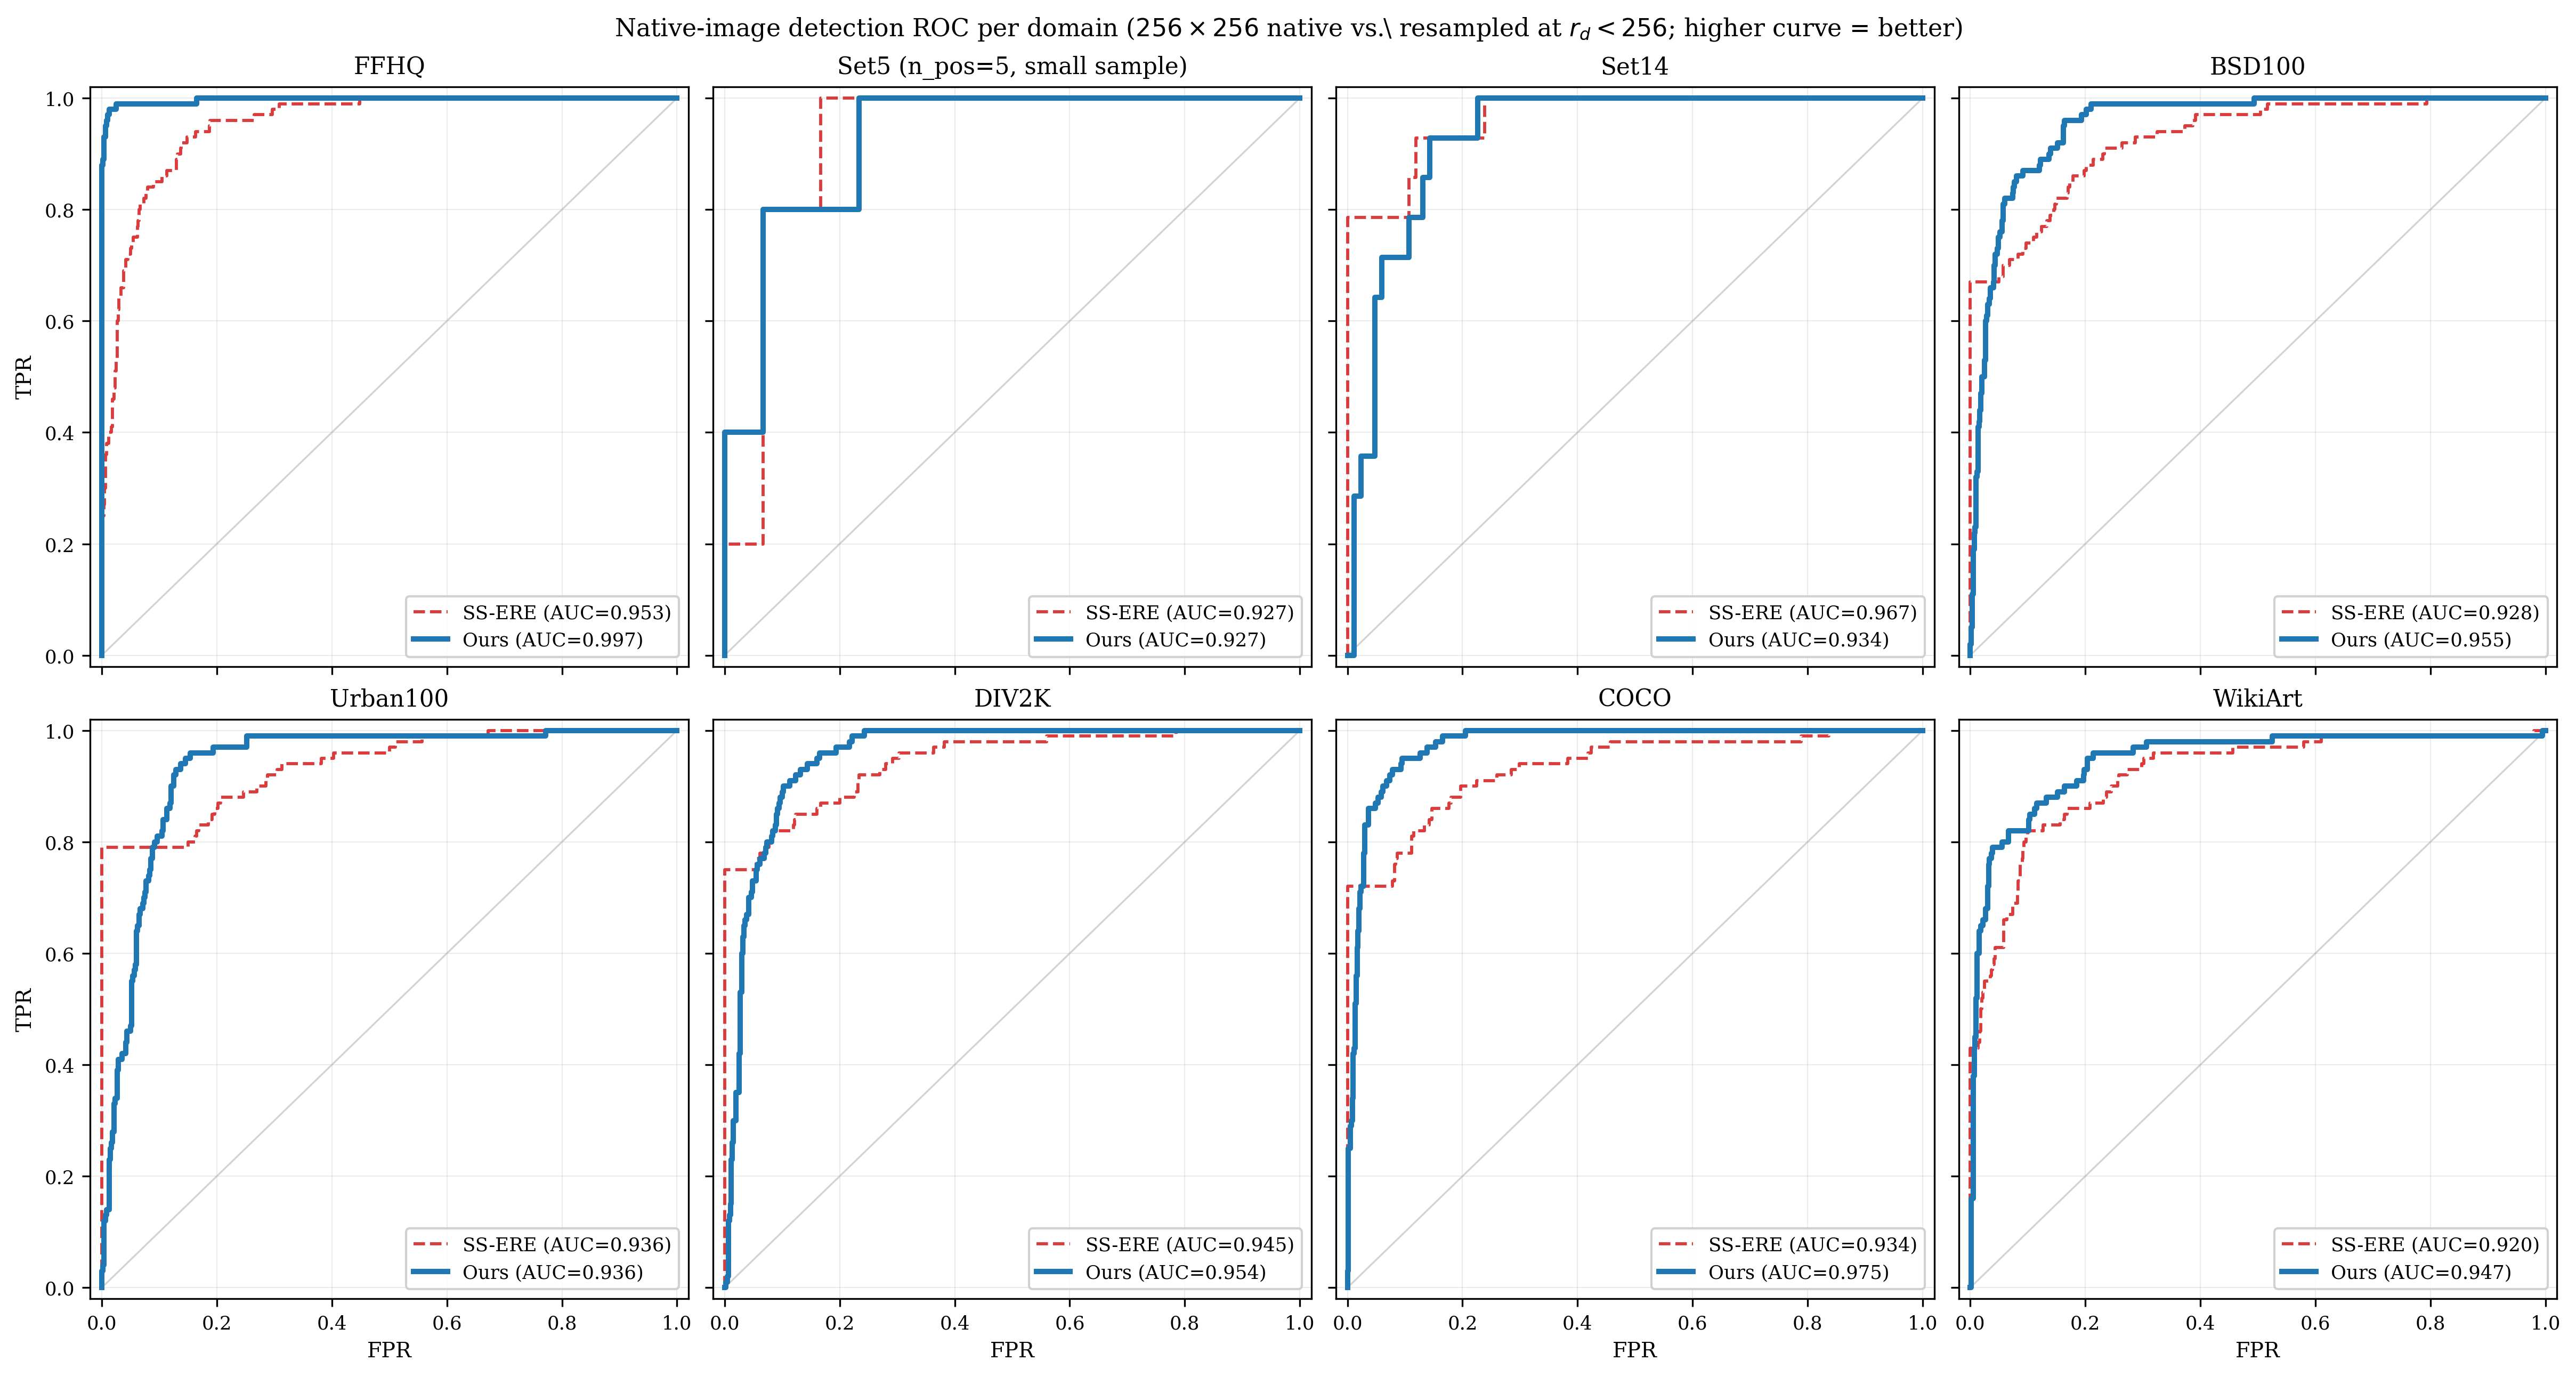
One panel per benchmark. In the practically relevant low-FPR regime (FPR ≤ 0.10) — the region where a real detection system operates — Ours (blue solid) reaches TPR ≥ 0.9 on COCO / DIV2K / Urban100, while SS-ERE (red dashed) plateaus below 0.85. The two ties are Set14 (n=14) and Set5 (n=5), both small-sample edge cases.


Native-Image Detection AUC


For every domain we ask whether the score can distinguish a native 256×256 image from a bicubically resampled one at rd ∈ {64, 96, 128, 160, 192, 224}. Pooled AUC averages across the six negative anchors weighted by number of pairs.


DatasetMethod vs 64vs 96vs 128 vs 160vs 192vs 224 Pooled
FFHQ SS-ERE1.0001.0000.9990.9800.9200.8140.952
Ours 1.0001.0001.0001.0000.9960.9890.998
Set5 (n=5) SS-ERE1.0001.0001.0000.9600.8400.7400.923
Ours 1.0001.0001.0001.0000.8800.6800.927
Set14 (n=14) SS-ERE1.0001.0001.0000.9900.8720.7420.934
Ours 0.9951.0000.8320.9850.9540.8370.934
BSD100 SS-ERE1.0000.9920.9820.9370.8400.7190.912
Ours 0.9870.9980.9900.9960.9520.8070.955
Urban100 SS-ERE1.0000.9960.9780.8990.7530.6370.877
Ours 0.9960.9900.9830.9890.9640.6950.936
DIV2K SS-ERE1.0000.9920.9850.9530.8700.7450.924
Ours 1.0001.0000.9920.9960.9620.7710.954
COCO SS-ERE1.0000.9830.9780.9450.8570.6770.907
Ours 0.9971.0000.9991.0000.9950.8580.975
WikiArt SS-ERE0.9910.9890.9750.9390.8600.7500.917
Ours 0.9710.9840.9650.9850.9590.8160.947
Mean SS-ERE0.9990.9940.9870.9500.8510.7280.918
Ours 0.9930.9960.9700.9940.9580.8070.953

Blue-highlighted values mark the winner per column per dataset. Both methods trivially handle heavy downscaling (rd ≤ 128); the real gap opens in the subtle-resampling regime (vs 224: 0.807 Ours vs 0.728 SS-ERE, a +7.9 pp advantage at just 12.5% downscaling).


Extension: Continuous reff Prediction


The same svar score also serves as a regression signal. A piecewise-linear calibration on 7 DIV2K-val anchors turns it into a continuous effective-resolution predictor. Reported on the half-native band rd ∈ {128, 160, 192, 224, 256}.


DatasetMethod MAE ↓MAPE ↓ Acc@10% ↑Acc@20% ↑ Spearman ρ ↑
FFHQ SS-ERE22.613.6%48%74%0.84
Ours 25.115.5%51%72%0.86
Set5 SS-ERE28.417.5%40%60%0.79
Ours 27.516.7%40%64%0.80
Set14 SS-ERE31.019.3%36%57%0.83
Ours 29.818.8%43%67%0.67
BSD100 SS-ERE26.816.0%38%65%0.76
Ours 33.319.8%41%62%0.83
Urban100SS-ERE35.321.5%30%55%0.71
Ours 29.217.9%44%68%0.80
DIV2K* SS-ERE28.017.0%37%64%0.79
Ours 22.814.1%55%76%0.84
COCO SS-ERE31.819.4%32%54%0.79
Ours 28.617.6%47%67%0.87
WikiArt SS-ERE24.213.8%44%73%0.76
Ours 32.820.0%44%62%0.82
Mean SS-ERE28.517.2%38%63%0.78
Ours 28.617.5%46%67%0.81

Blue-highlighted values = per-metric winner. Ours "clean-sweeps" 3 of 8 domains (Urban100, DIV2K, COCO) and wins Acc@10% + Spearman ρ in the cross-domain mean. SS-ERE remains competitive on absolute error metrics (MAE/MAPE), reflecting its supervised regression objective.


Ablations


ablation aggregate

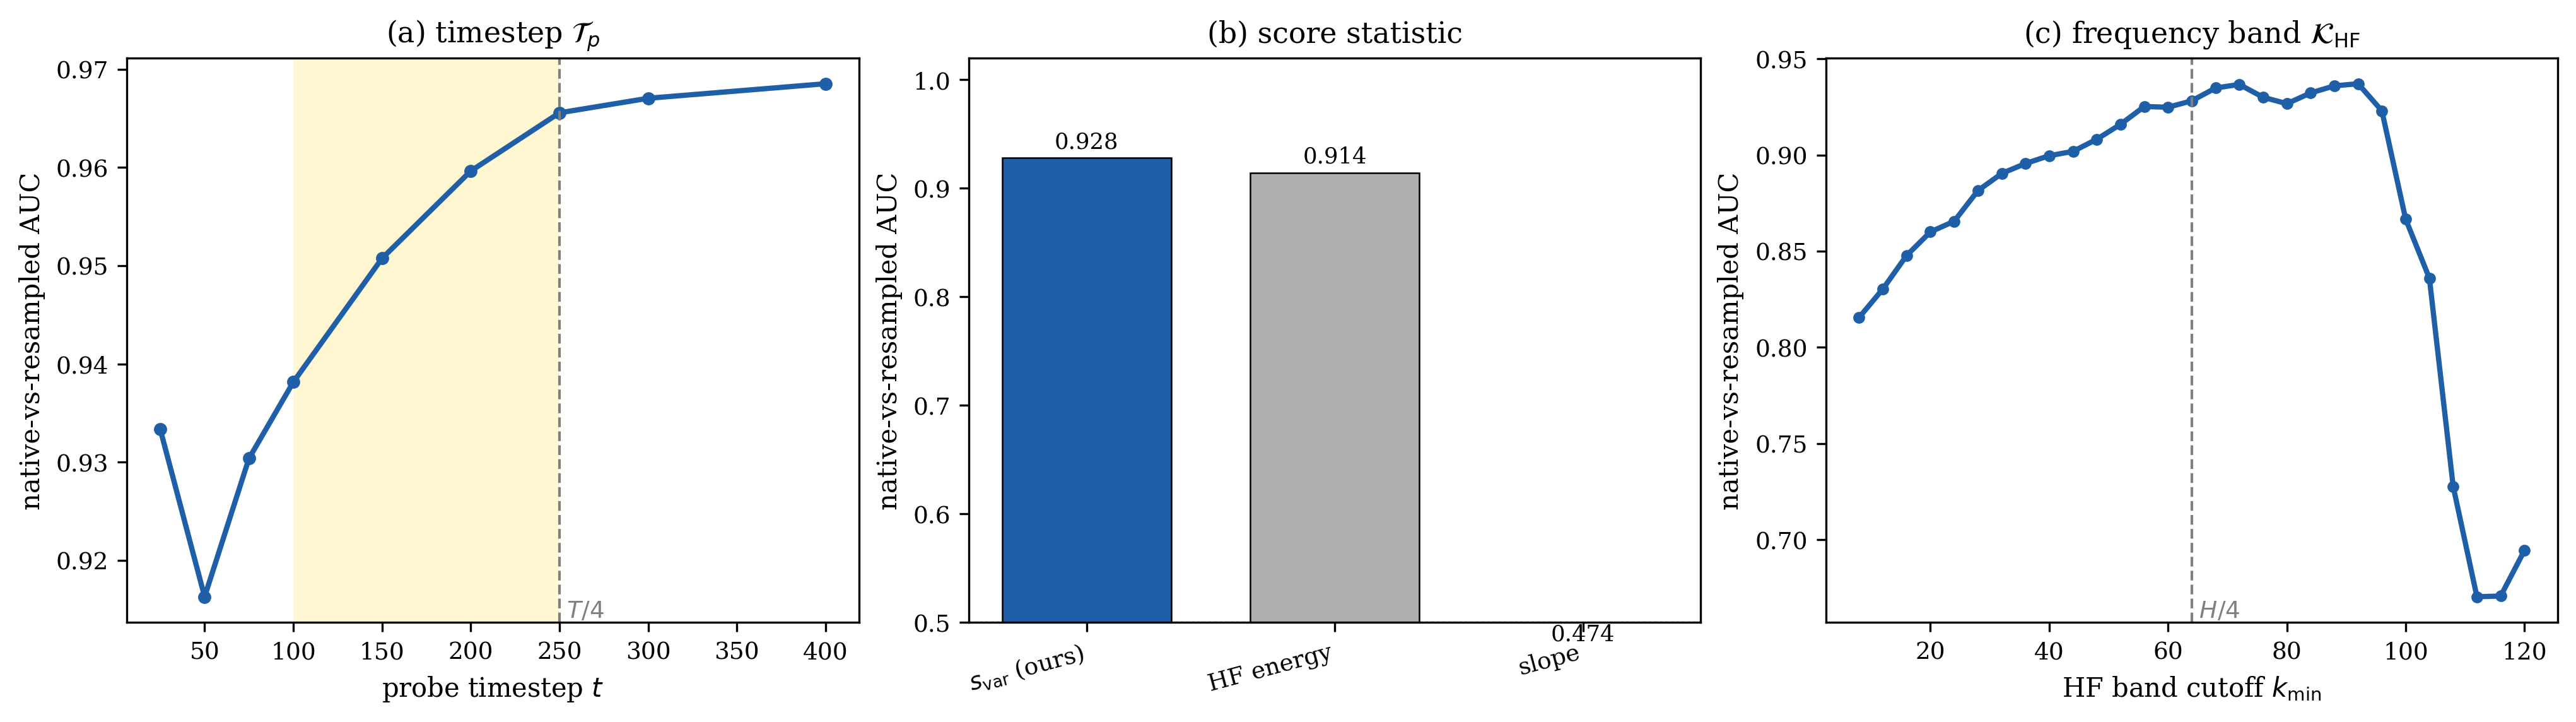
(a) Timestep Tp: single-timestep native-vs-resampled AUC rises and saturates by t = T/4 (250), justifying the plateau window and the T/4 inversion truncation. (b) Score statistic: among single-statistic candidates our joint (t,k)-variance svar beats HF energy and log–log spectral slope. (c) Frequency band: AUC peaks near kmin = H/4 = 64 and collapses beyond k > 100, justifying KHF = [64, 128).


BibTeX


@inproceedings{kim2026pixres,
  title     = {Noise Frequencies Let a Pixel-Space Diffusion Prior Detect Native-Resolution Image},
  author    = {Kim, Bumsoo and Jin, Hyun-Jun and Lee, Mi Young and Rho, Seungmin and Seo, Sanghyun},
  booktitle = {ECCV 2026 Workshop on Low-Level Vision Frontier (LoViF)},
  year      = {2026}
}


References


  1. SS-ERE. Kansy et al. — Self-supervised effective-resolution estimation with adversarial augmentations. WACV 2023. [link]
  2. ADM. Dhariwal & Nichol — Diffusion models beat GANs on image synthesis. NeurIPS 2021. [link]
  3. DDIM inversion. Song et al. — Denoising diffusion implicit models. ICLR 2021. [link]
  4. Score-based generative modelling / PF-ODE. Song et al. — Score-based generative modeling through stochastic differential equations. ICLR 2021. [link]
  5. DiffusionAD / Inv-AD (inspiration). Mousakhan et al., DAGM 2024; Sakai & Hasegawa, arXiv 2504.
  6. Pixel-space diffusion — frequency-aware structure. Ma et al. (DeCo, 2025); Yu et al. (PixelDiT, 2025).